SpringBoot项目监控-Prometheus+Grafana
目录
介绍
Prometheus
Grafana
使用场景
特性
简单使用
SpringBoot配置
引入依赖
配置文件application.properties
启动
应用添加到Prometheus
下载
配置
启动
使用 Grafana Dashboard 展示应用数据
配置Prometheus数据源
配置监控面板
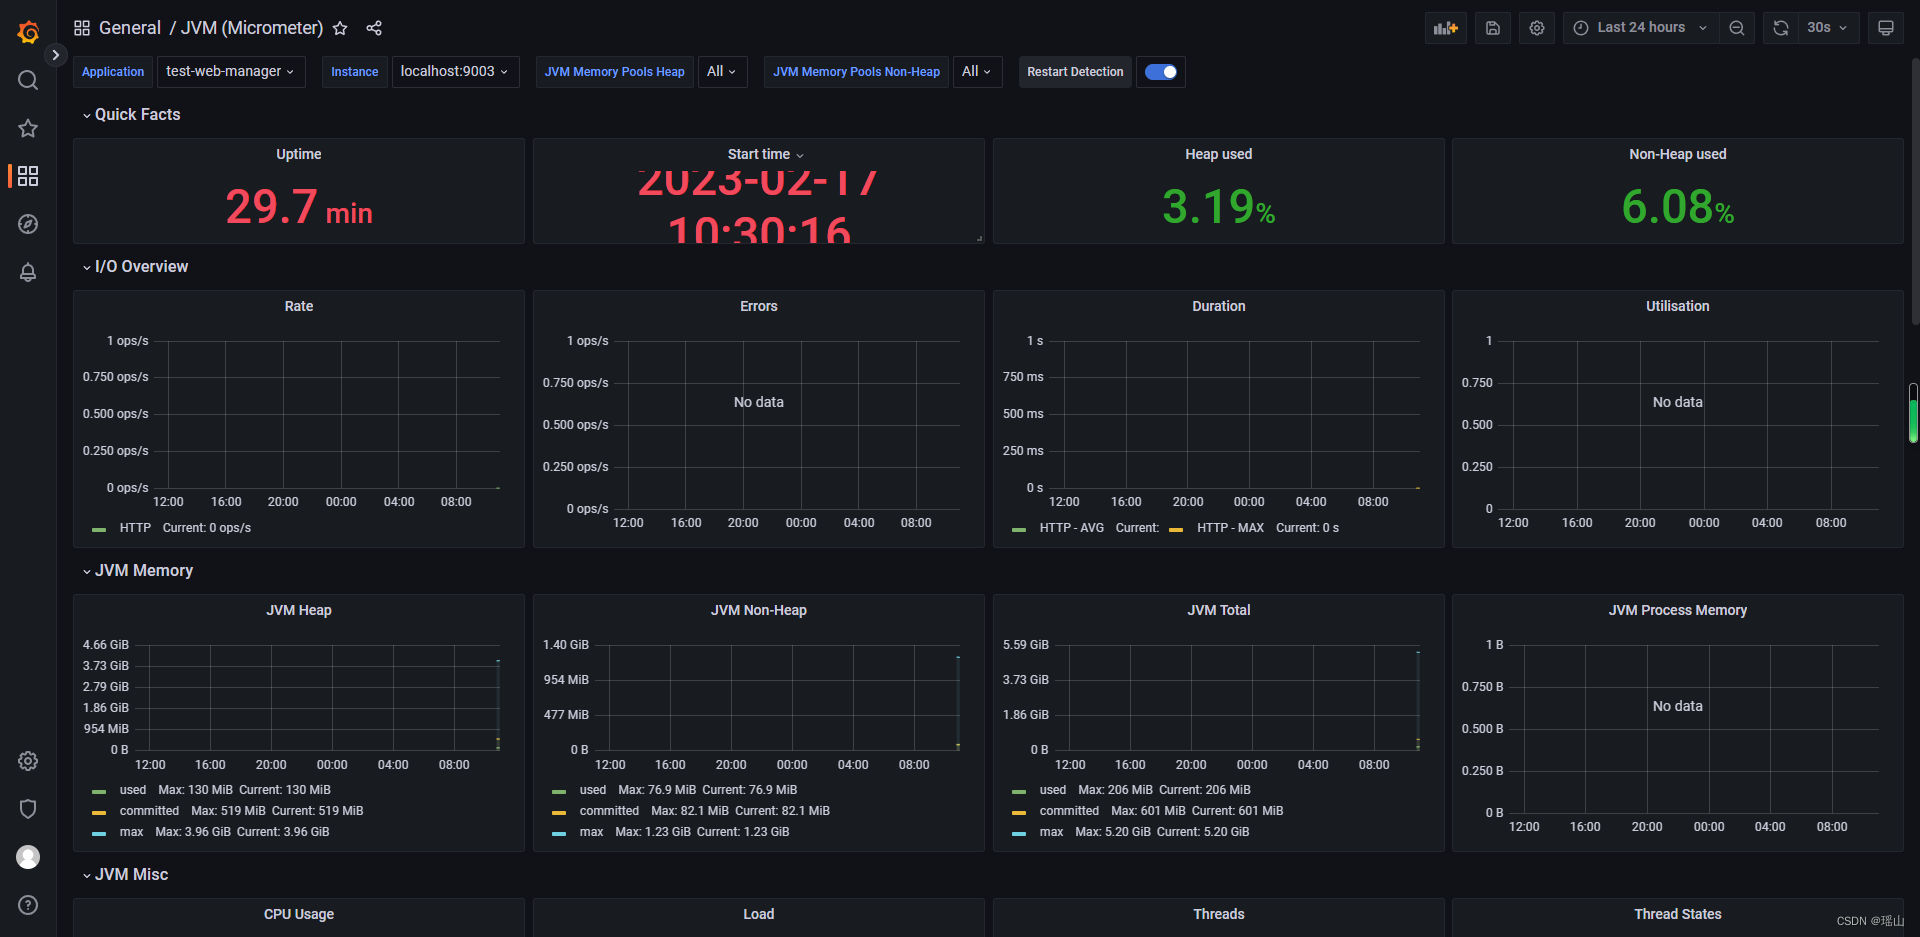
效果
其他
介绍
Prometheus
Prometheus是一个开源的系统监控和报警系统,同时也支持多种exporter采集数据,还支持pushgateway进行数据上报,Prometheus性能足够支撑上万台规模的集群。
Grafana
熟悉监控的同学都知道,Grafana 是一个可视化工具,简单点说就是用来展示数据的。它和Zabbix、Prometheus 有本质区别,在于它不能解决监控问题,仅用于展示。也就是说,在监控领域,Grafana 需要配合 Zabbix、Prometheus 等工具一起使用,以获取数据源。
简单来说, 配套Grafana 使用可以呈现出非常多样化的图表配置
使用场景
运维人员, 需要监控机器的 CPU、内存、硬盘的使用情况,以此来保证运行在机器上的应用的稳定性。
研发人员, 他们关注某个异常指标的变化情况,从而来保证业务的稳定运行。
产品或运营,他们更关心产品层面的事情,例如:某个活动参加人数的增长情况,活动积分的发放情况
所以弄清楚此时此刻系统的运行是否正常, 各项业务指标是否超过阈值, 就需要一套数据监控解决方案。它能让你随时掌控系统的运行状态,快速定位出现问题的位置,快速排除故障
当然, 对于流量不是很大的系统来说,出现几分钟的故障可能造成不了多少损失。但是对于像淘宝、美团、字节跳动这样的巨无霸来说,宕机 1 分钟损失的金额可能就是几百万
特性
- 多维数据模型,其中包含由指标名称和键/值对标识的时间序列数据
- PromQL,一种灵活的查询语言,表现力/内置统计函数强大
- 不依赖分布式存储; 单服务器节点是自治的
- 时间序列收集通过HTTP上的pull模型进行
- 通过中间网关支持推送(push)时间序列
- 通过服务发现或静态配置发现目标
- 支持多种模式的图形和仪表盘
- Golang 实现,运行速度快
- 支持对云的或容器的监控
- 属于一站式监控告警平台,依赖少,功能齐全
- 低成本
简单使用
SpringBoot配置
引入依赖
org.springframework.boot spring-boot-starter-actuator io.micrometer micrometer-registry-prometheus 1.6.12 io.micrometer micrometer-core 1.6.12 io.github.mweirauch micrometer-jvm-extras 0.2.2 配置文件application.properties
management.endpoints.web.exposure.include=*
management.metrics.export.simple.enabled=true
management.metrics.export.jmx.enabled=true
# 默认使用项目端口, 可单独指定
management.server.port=9003
management.endpoints.web.base-path=/actuator
management.metrics.tags.application=${spring.application.name}
management.metrics.tags.tag=${spring.application.name}
management.metrics.export.prometheus.enabled=true
management.metrics.distribution.percentiles-histogram.http.server.requests= false
management.metrics.distribution.minimum-expected-value.http.server.requests= 20ms
management.metrics.distribution.maximum-expected-value.http.server.requests= 200ms
management.endpoint.metrics.enabled=true
management.endpoint.health.show-details=always
management.endpoint.health.probes.enabled=true
management.endpoint.prometheus.enabled=true
include=* 配置为开启 Actuator 服务,Spring Boot Actuator 自带了一个/actuator/Prometheus 的监控端点供给Prometheus 抓取数据。不过默认该服务是关闭的,所以,使用该配置将打开所有的 Actuator 服务
启动
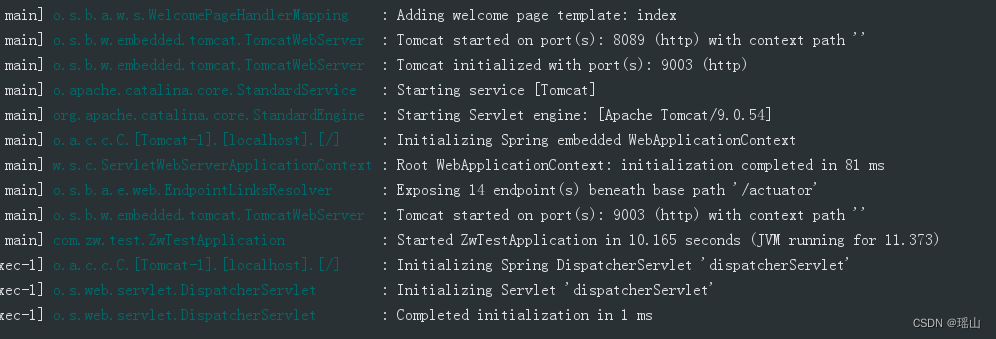
访问http://127.0.0.1:9003/actuator/prometheus
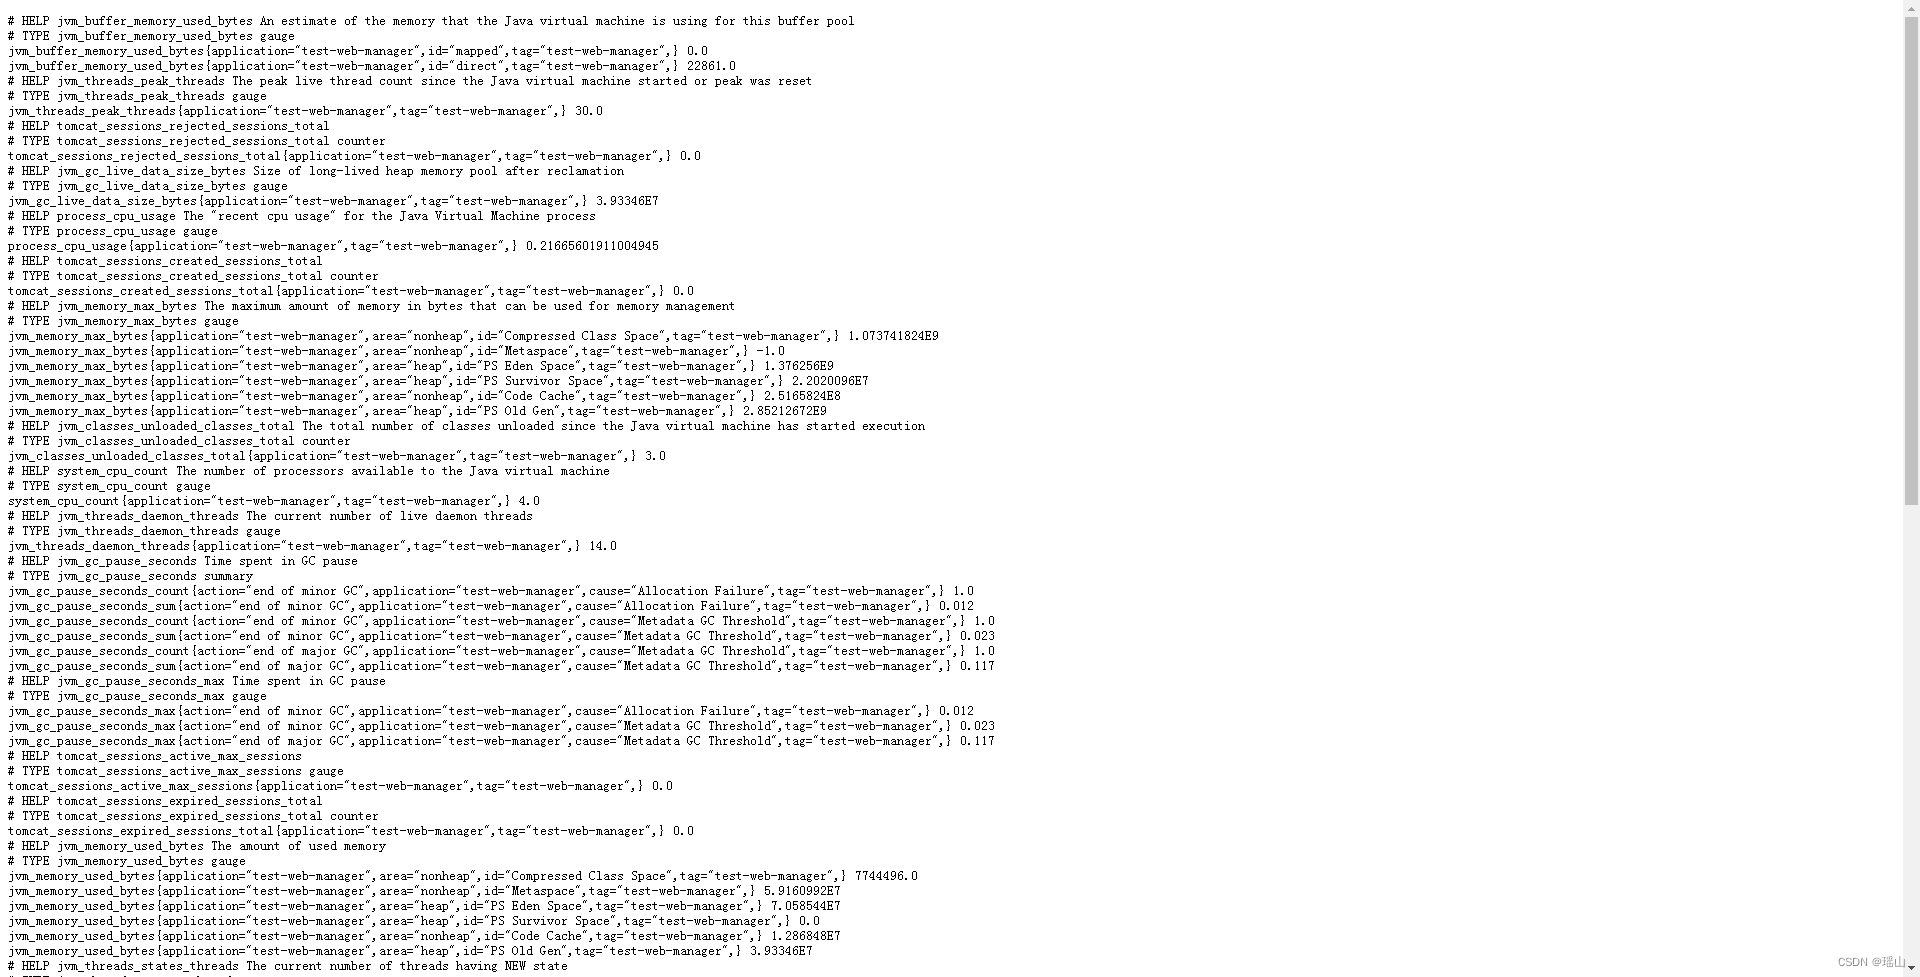
Spring Boot Actuator 默认的端点很多,详见
Spring Boot Actuator: Production-ready Features
应用添加到Prometheus
下载
前面Spring Boot应用已经启动成功,并暴露了/actuator/Prometheus的监控端点。接下来我们将此应用添加到Prometheus。
Windows下载安装Prometheus_prometheus安装windows_瑶山的博客-CSDN博客
配置
修改Prometheus配置文件prometheus.yml
# 采集SpringBoot监控数据- job_name: 'prometheusapp'metrics_path: '/actuator/prometheus'static_configs:- targets: ['localhost:9003']完整配置
# my global config
global:scrape_interval: 15s # Set the scrape interval to every 15 seconds. Default is every 1 minute.evaluation_interval: 15s # Evaluate rules every 15 seconds. The default is every 1 minute.# scrape_timeout is set to the global default (10s).# Alertmanager configuration
alerting:alertmanagers:- static_configs:- targets:# - alertmanager:9093# Load rules once and periodically evaluate them according to the global 'evaluation_interval'.
rule_files:# - "first_rules.yml"# - "second_rules.yml"# A scrape configuration containing exactly one endpoint to scrape:
# Here it's Prometheus itself.
scrape_configs:# The job name is added as a label `job=` to any timeseries scraped from this config.- job_name: "prometheus"# metrics_path defaults to '/metrics'# scheme defaults to 'http'.static_configs:- targets: ["localhost:9090"]# 采集SpringBoot监控数据- job_name: 'prometheusapp'metrics_path: '/actuator/prometheus'static_configs:- targets: ['localhost:9003']
启动
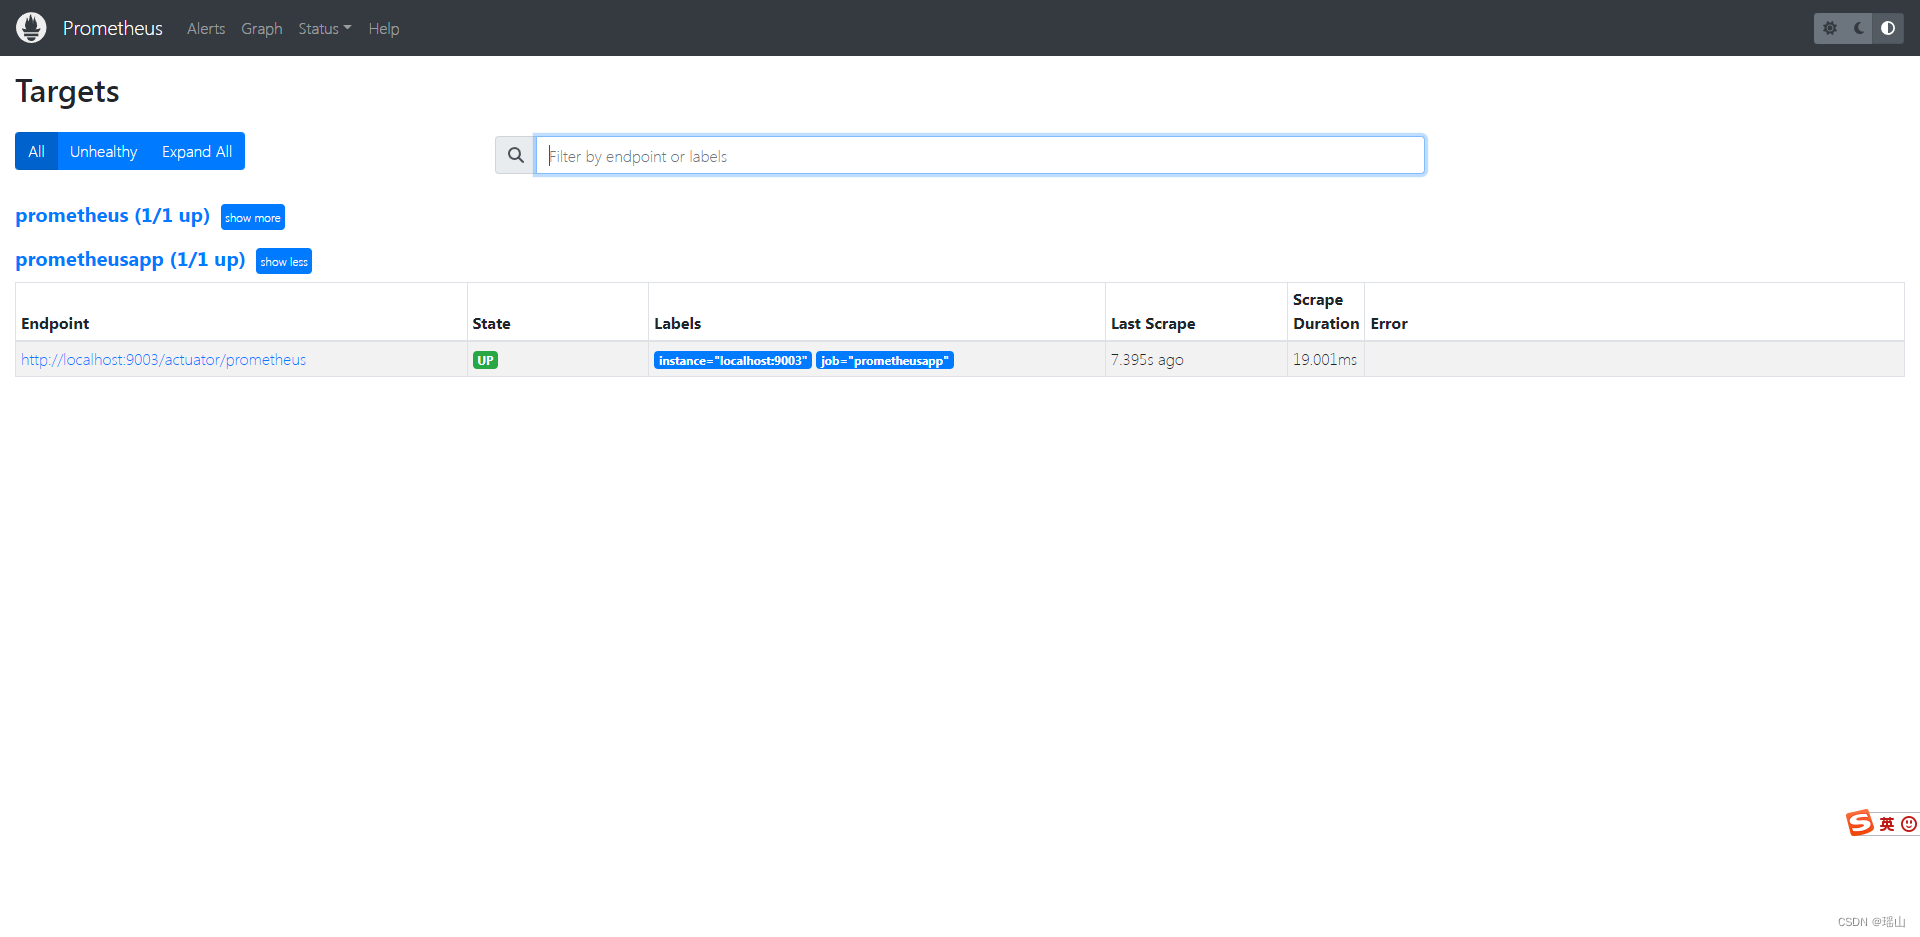
重启 Prometheus 服务,查看 Prometheus UI 界面确认 Target 是否添加成功。
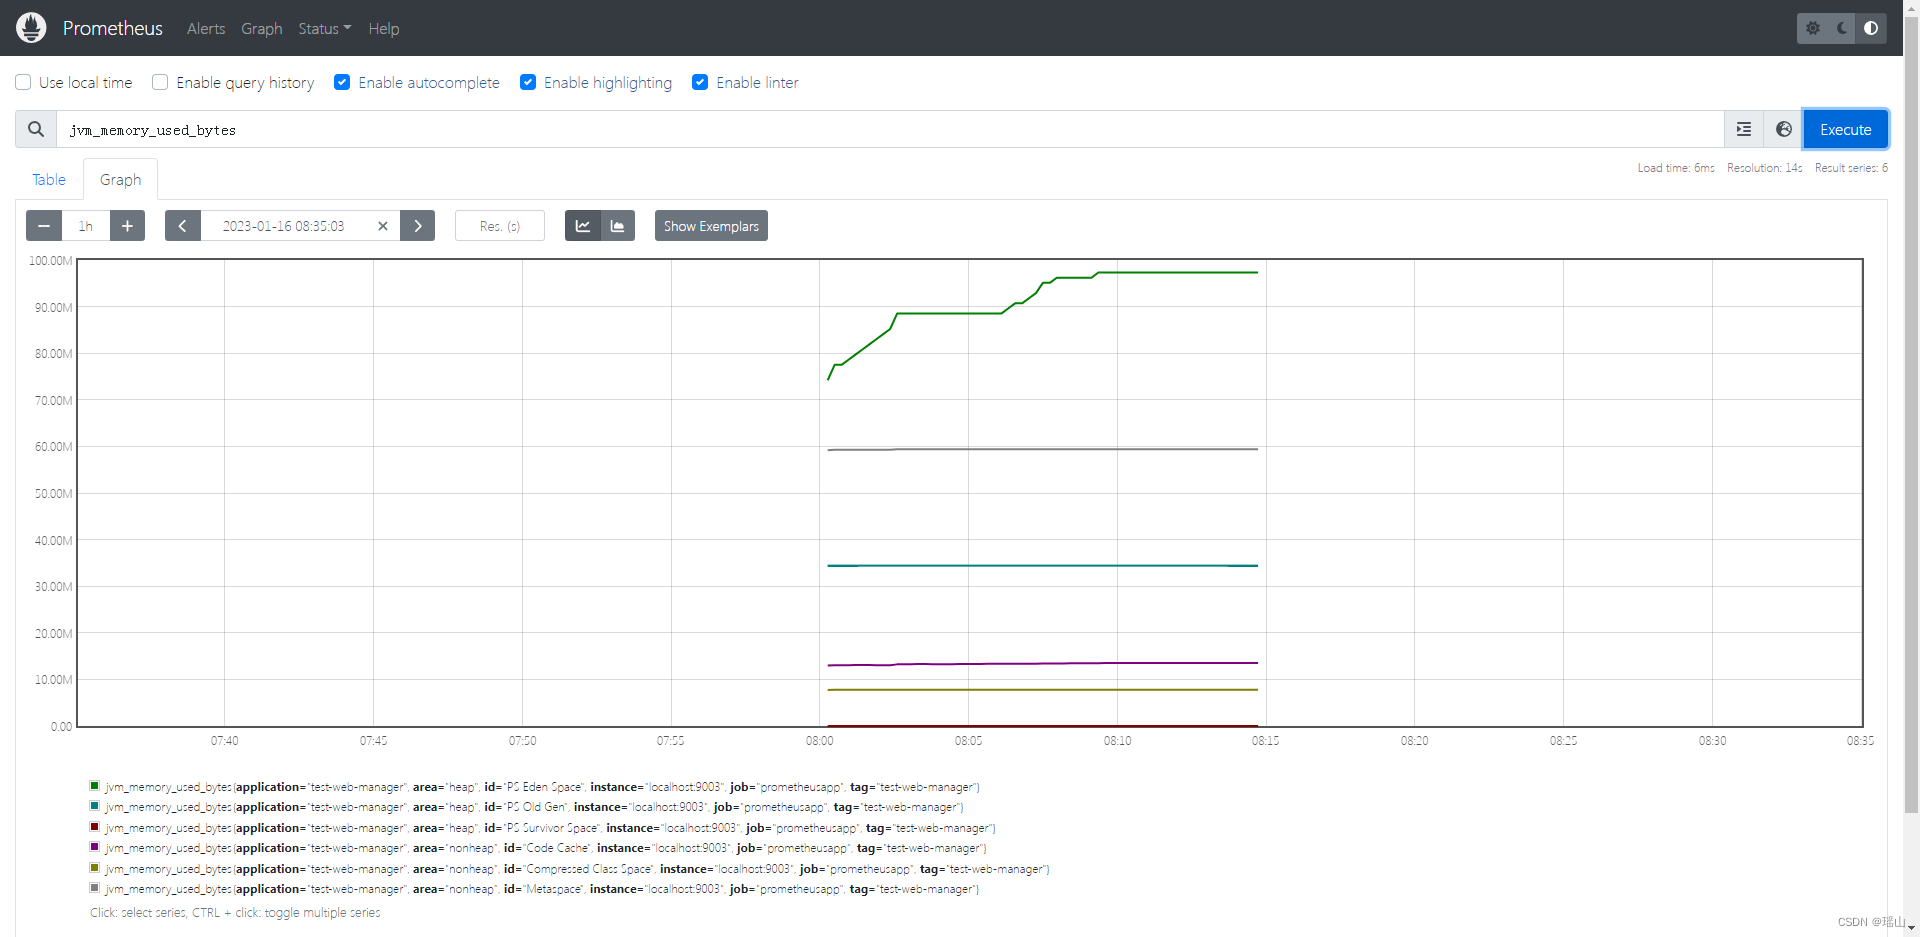
可以在 Graph 页面执行一个简单的查询,也是获取 PrometheusApp服务的相关性能指标值。
使用 Grafana Dashboard 展示应用数据
Windows下载安装Grafana
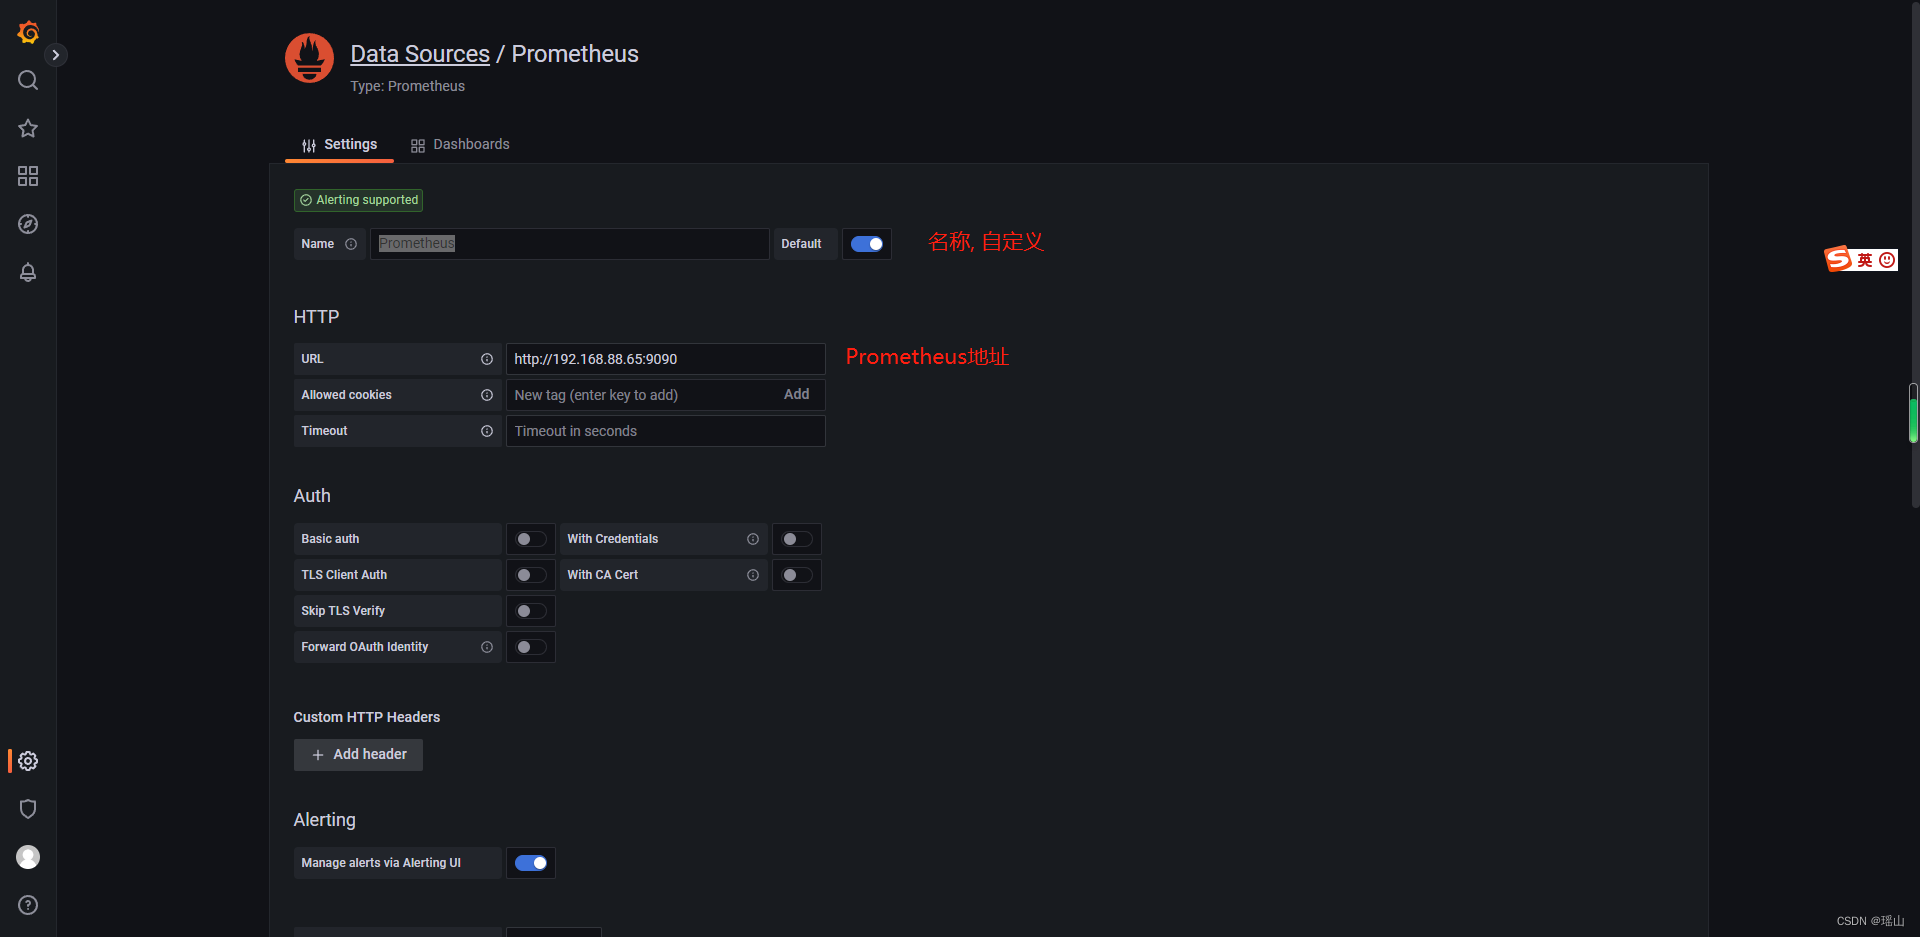
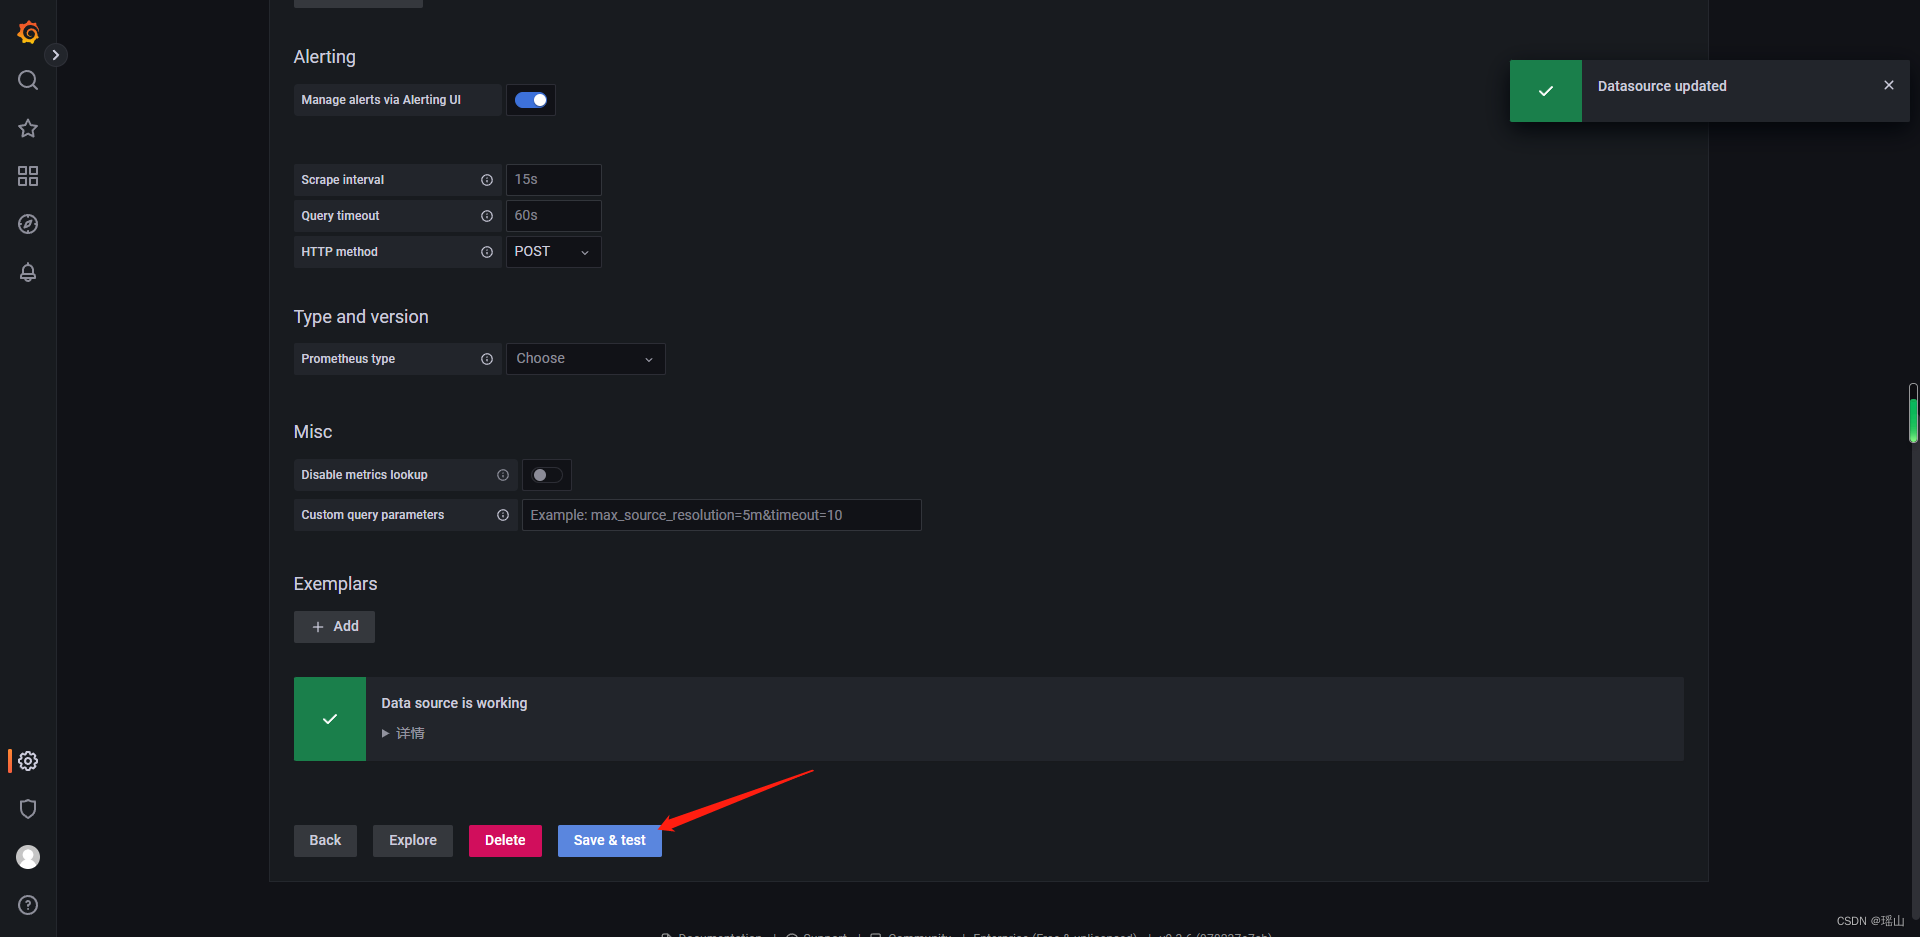
配置Prometheus数据源
点击左下角齿轮(设置),选中Date sources
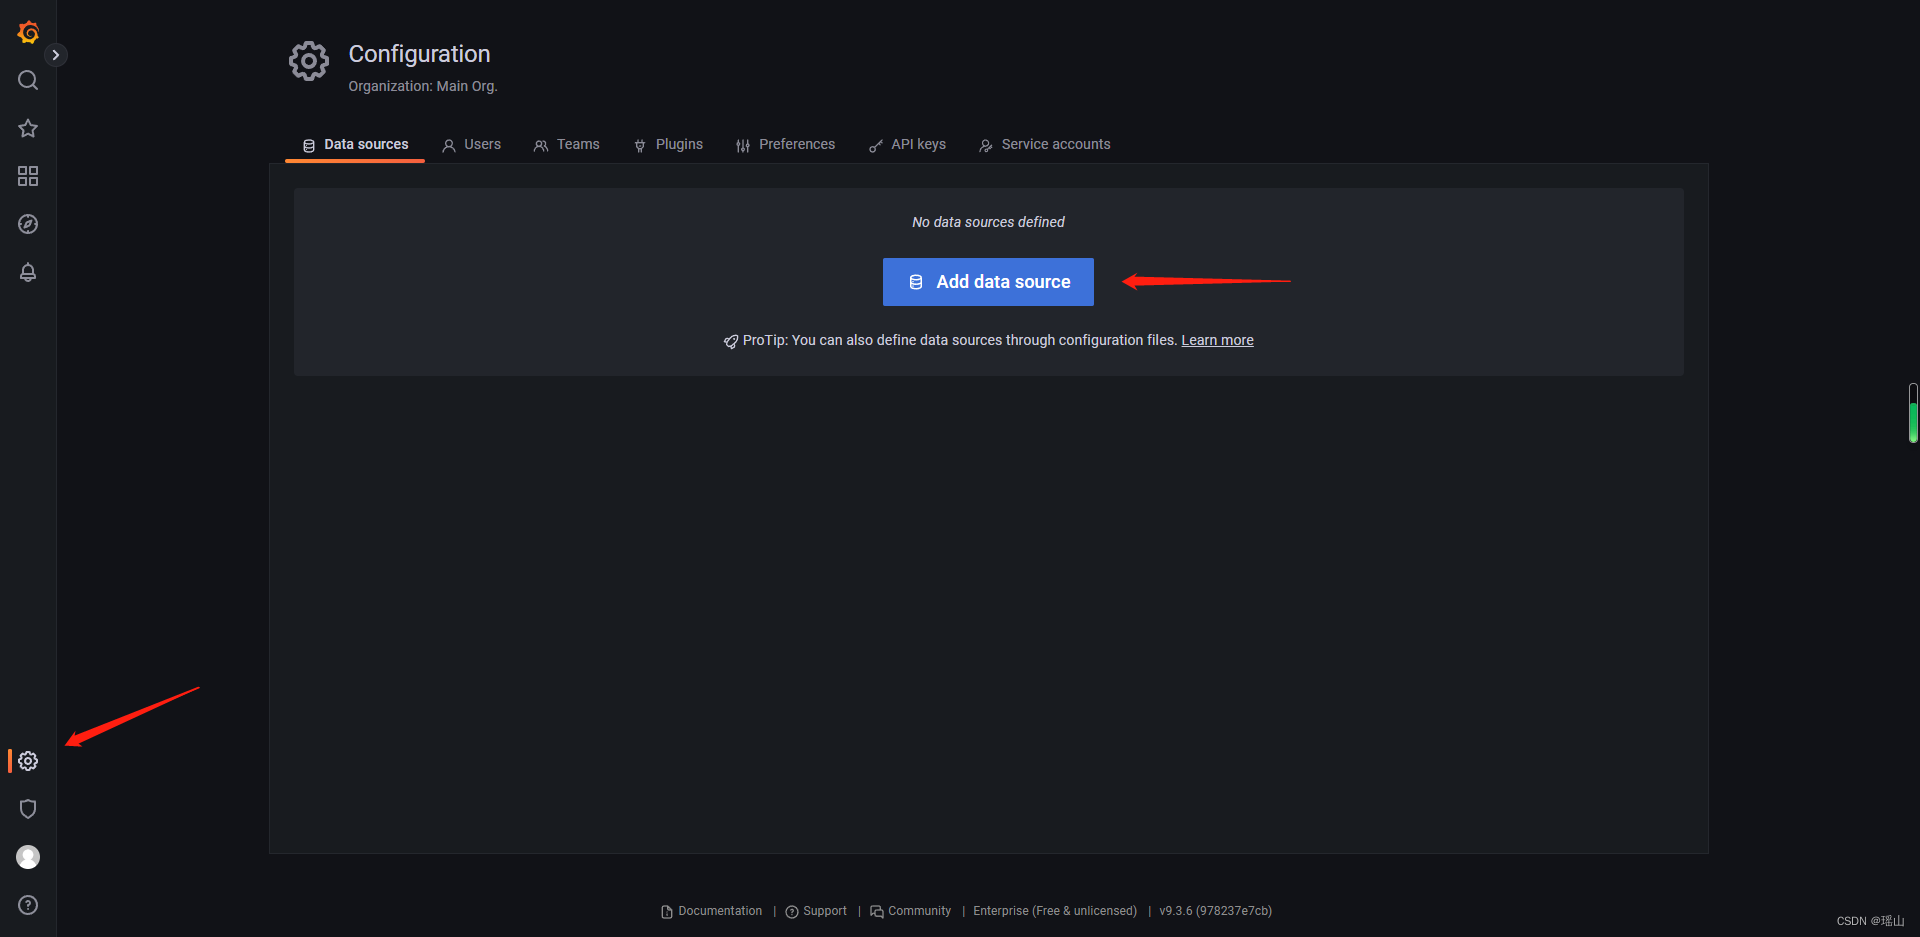
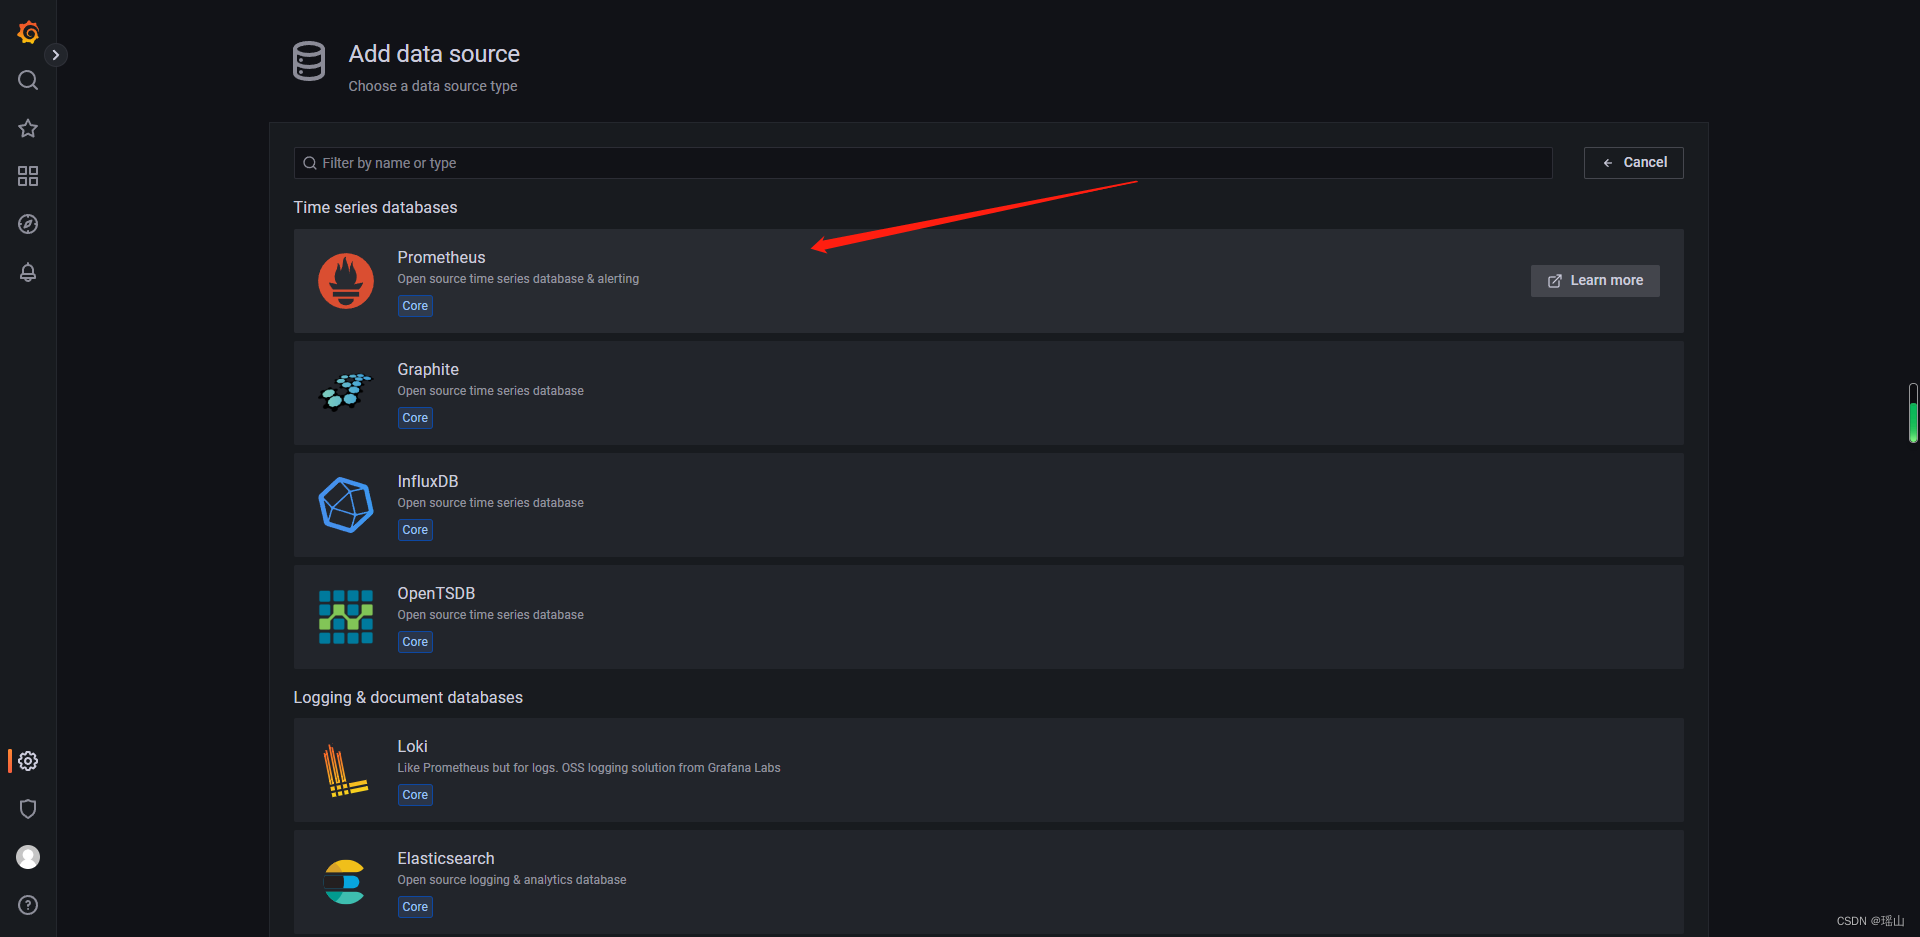
添加数据源
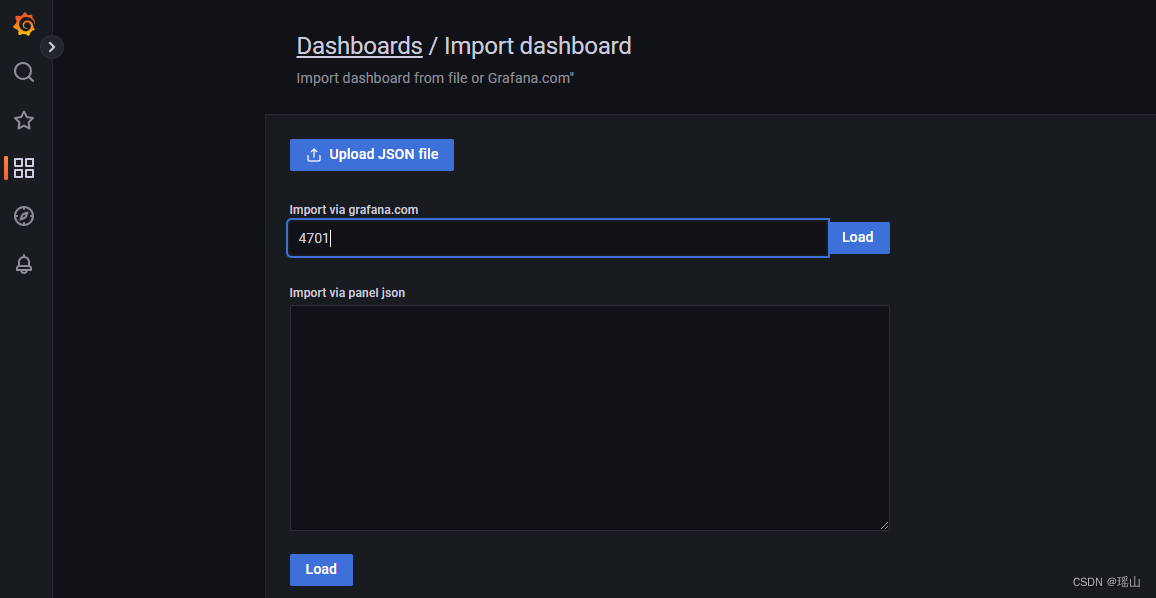
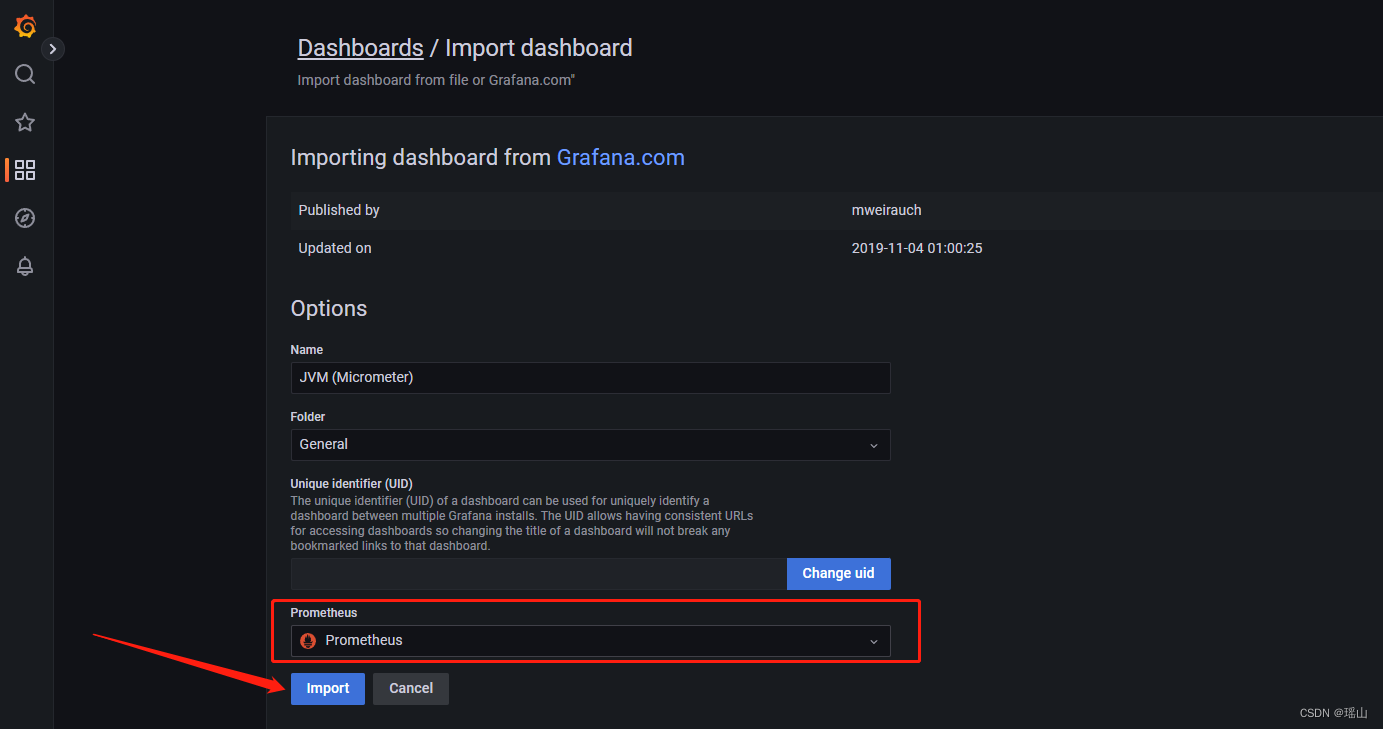
配置监控面板
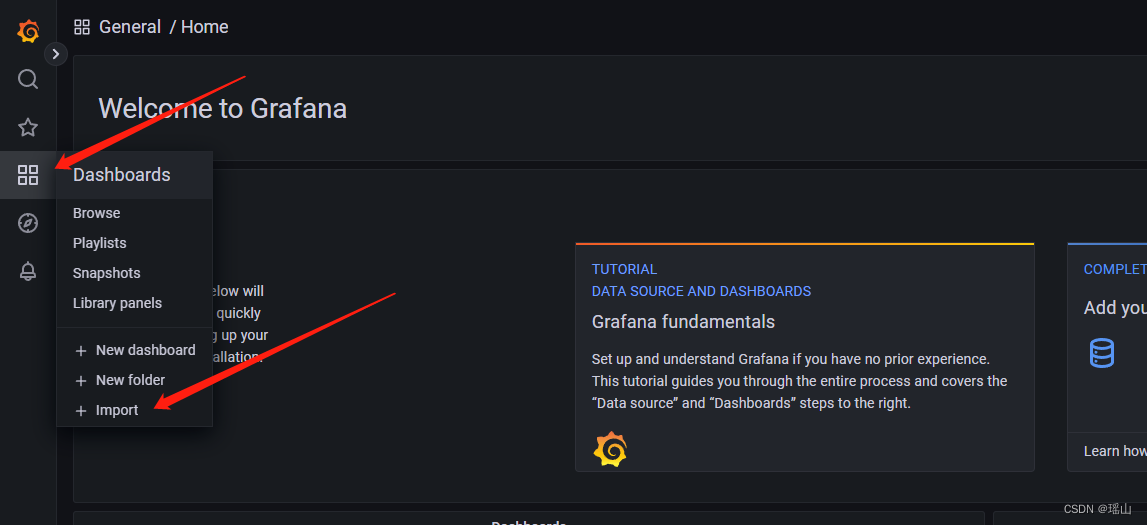
输入面板对应ID, 点击load可加载对应面板模板, 4701-JVM监控面板
效果
其他
Windows下载安装Grafana_瑶山的博客-CSDN博客
Windows下载安装Prometheus_prometheus安装windows_瑶山的博客-CSDN博客
下一篇:Android面试题——JVM